Projects
Detecting Diabetic Retinopathy w/ Computer Vision
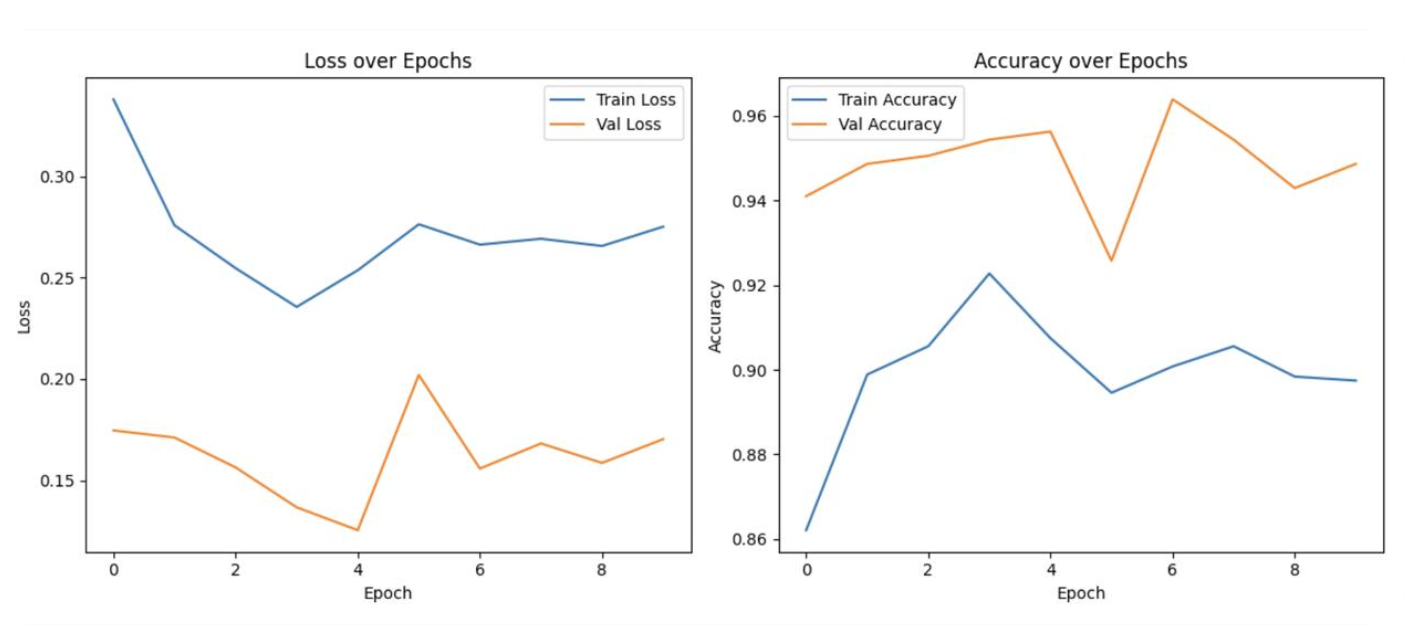
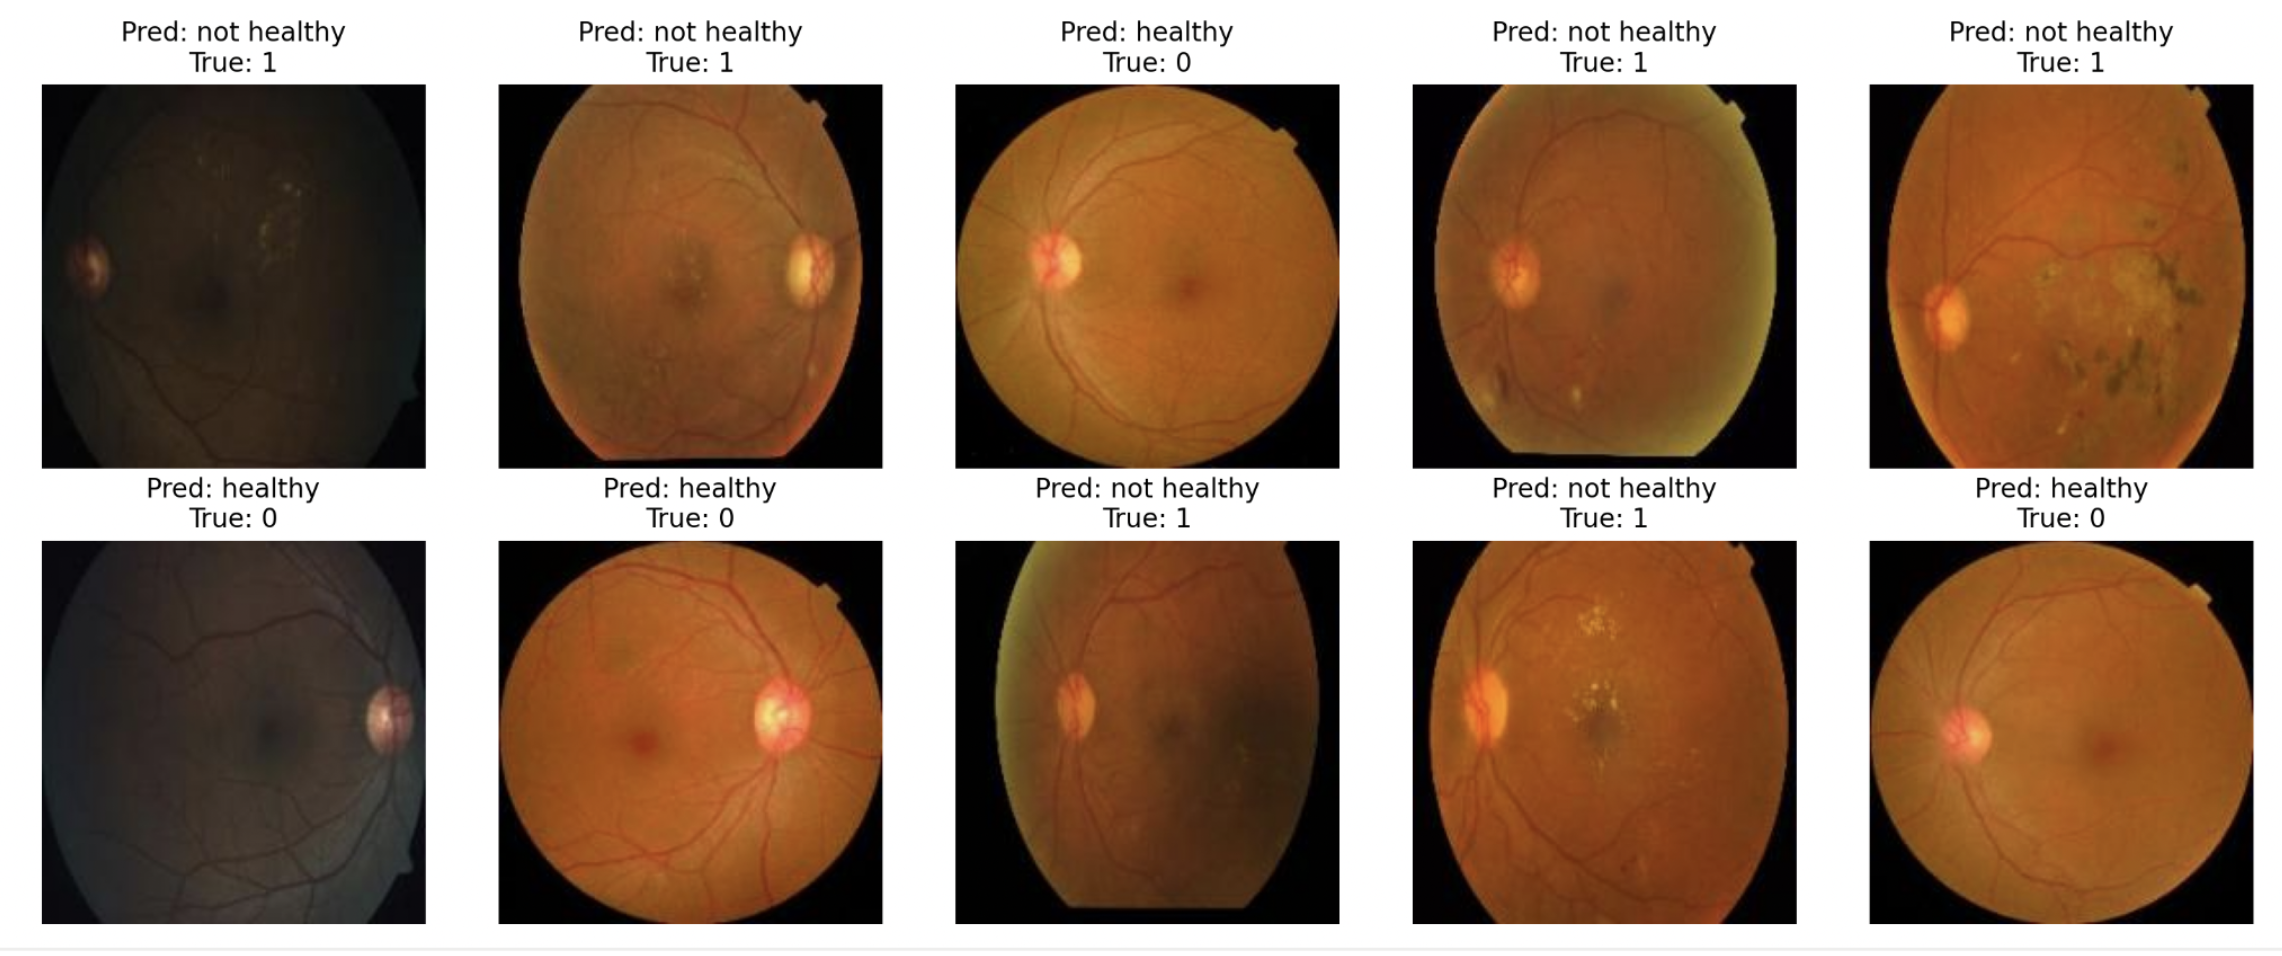
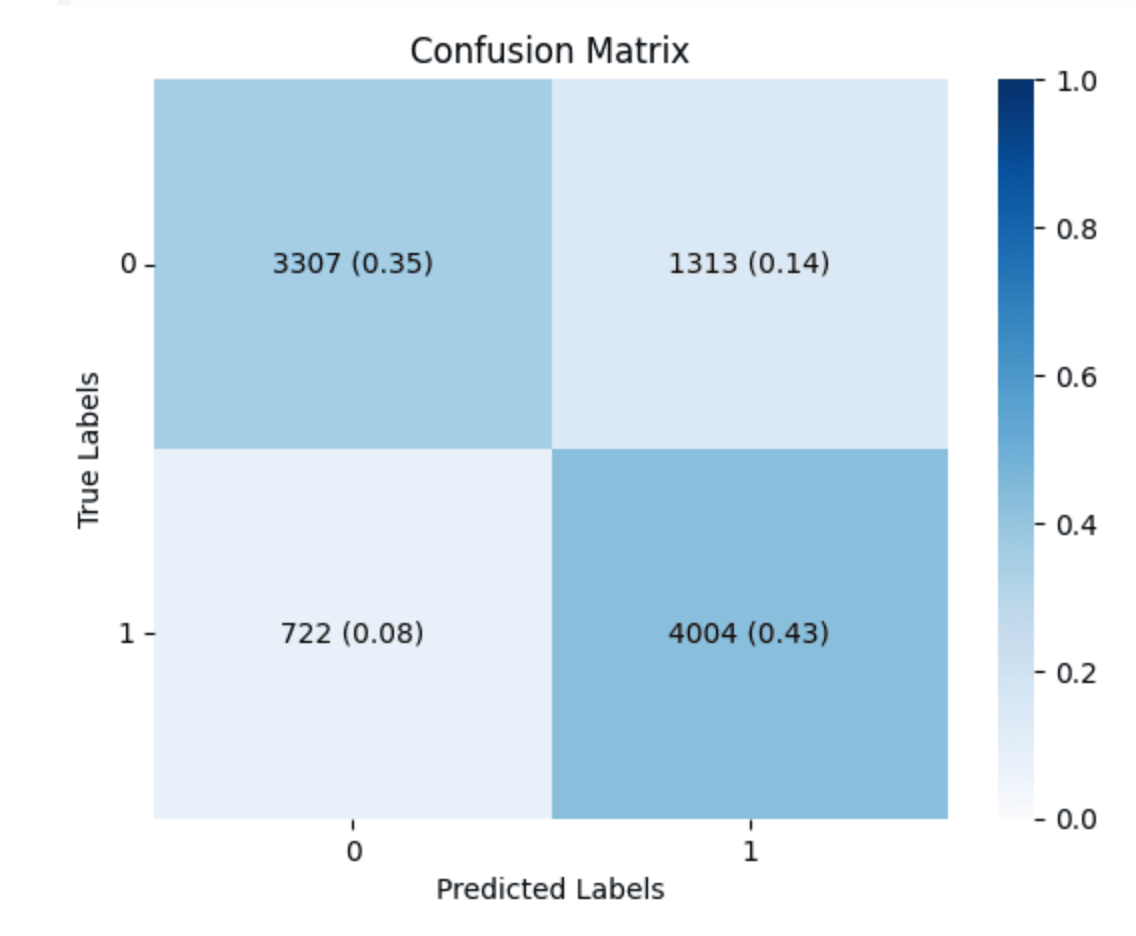
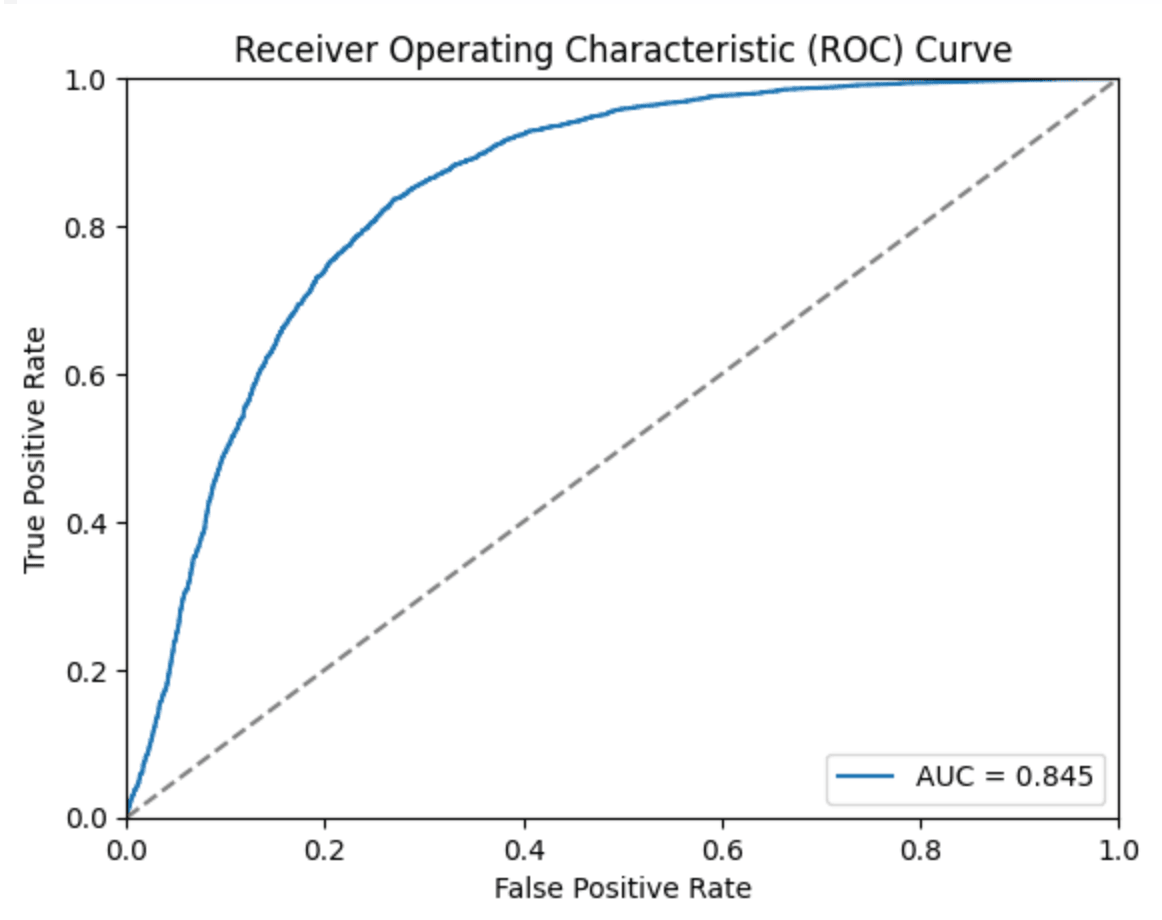
For this project, my team and I trained a ResNet50 CNN to detect diabetic retinopathy, an eye disease that affects millions worldwide, from pateint retina scans. We implemented rigorous data augmentation and regularization to combat overfitting and achieved a 96% accuracy. Moreover, we integrated AWS S3 for efficient data storage and retrieval throughout the training pipeline.
Visit the project’s repository below!
Predicting Credit Card Default with Neural Networks
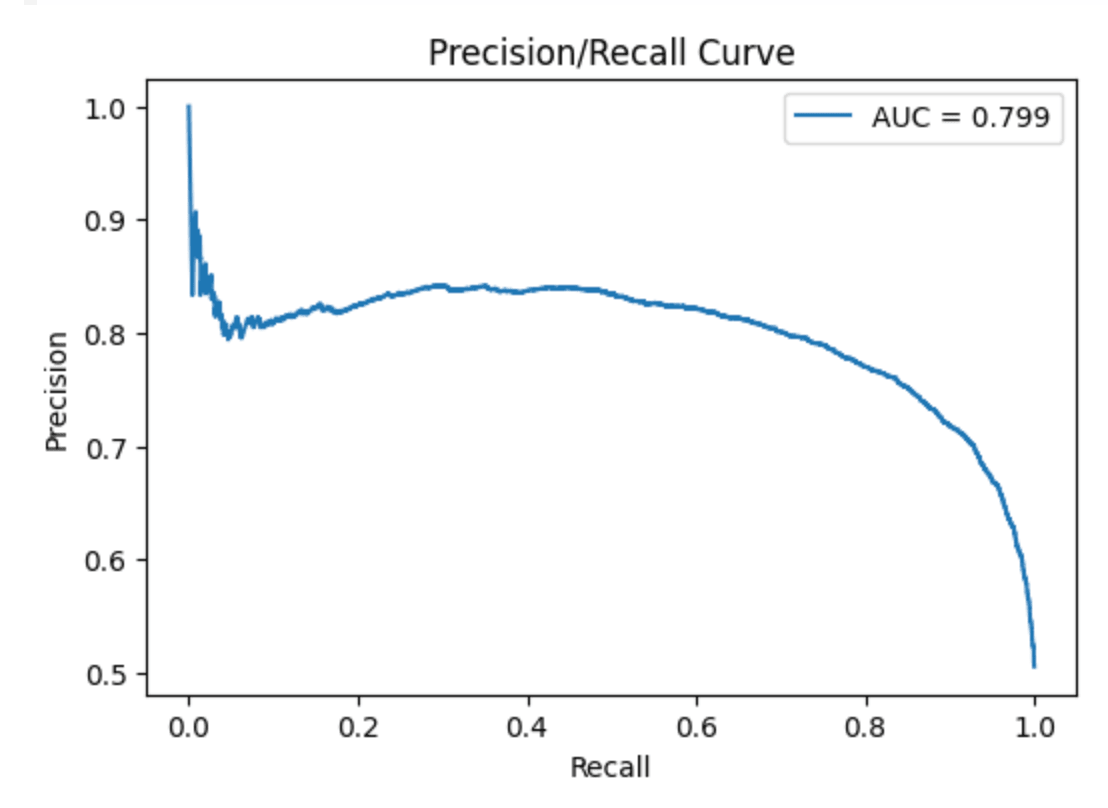
In this project, I utilized PyTorch to construct a neural network which predicts credit card default among clients. Using various statistical techniques, model performance was improved by 140%. The final model achieved a prediction accuracy of 78% and performed well according to other evaluation metrics such as ROC-AUC and precision/recall.
The full project including code and visualizations can be found in the GitHub repository below.
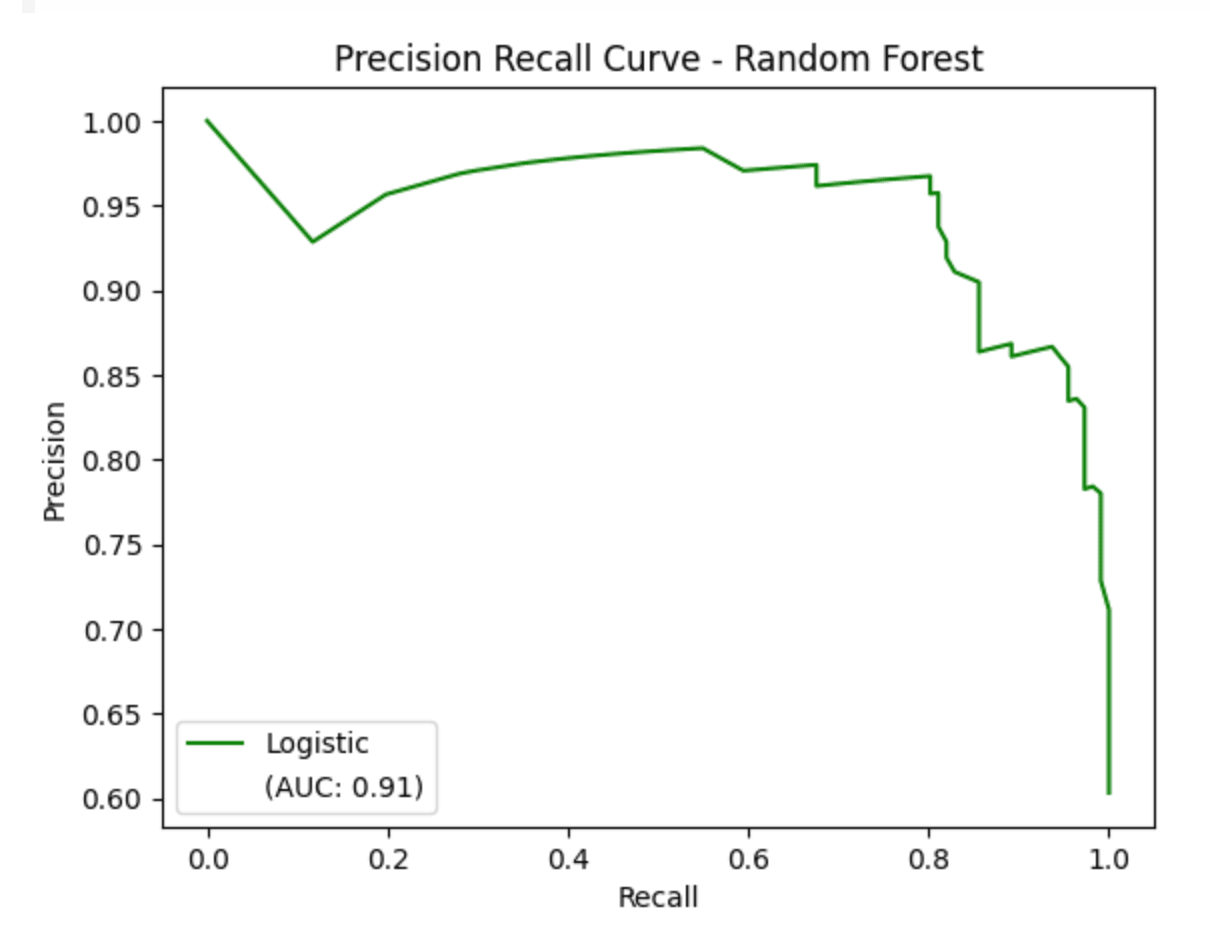
Predictive Modeling of Heart Disease
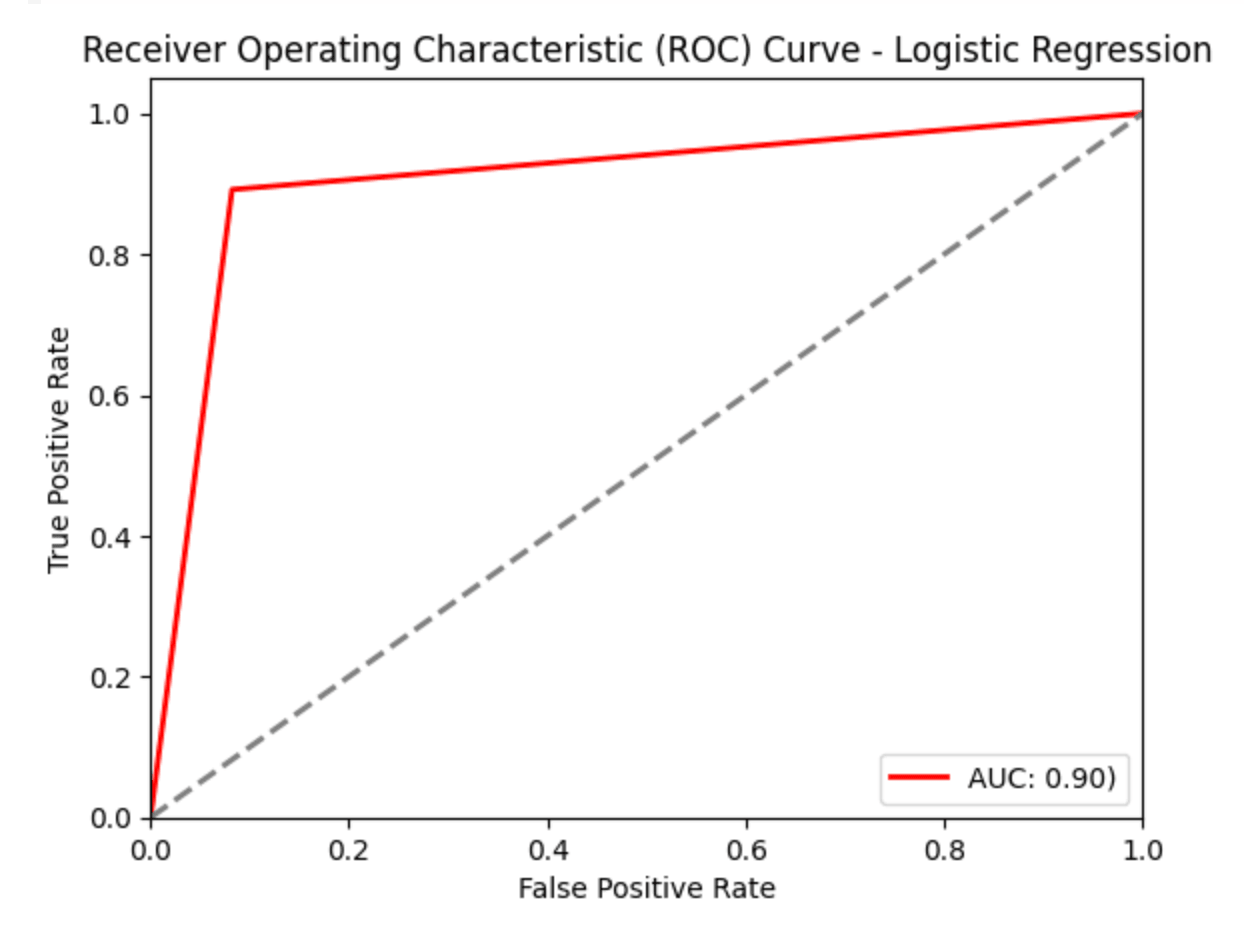
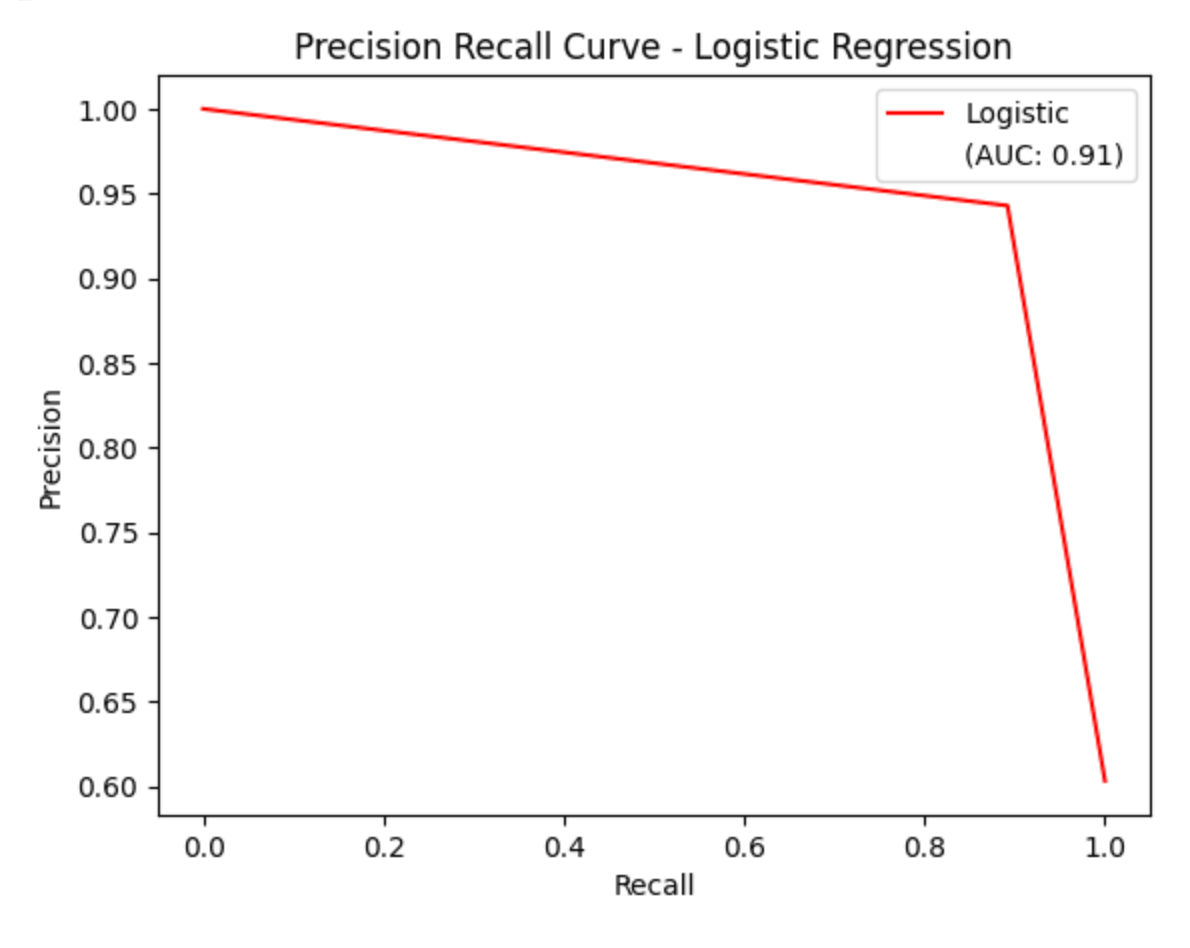
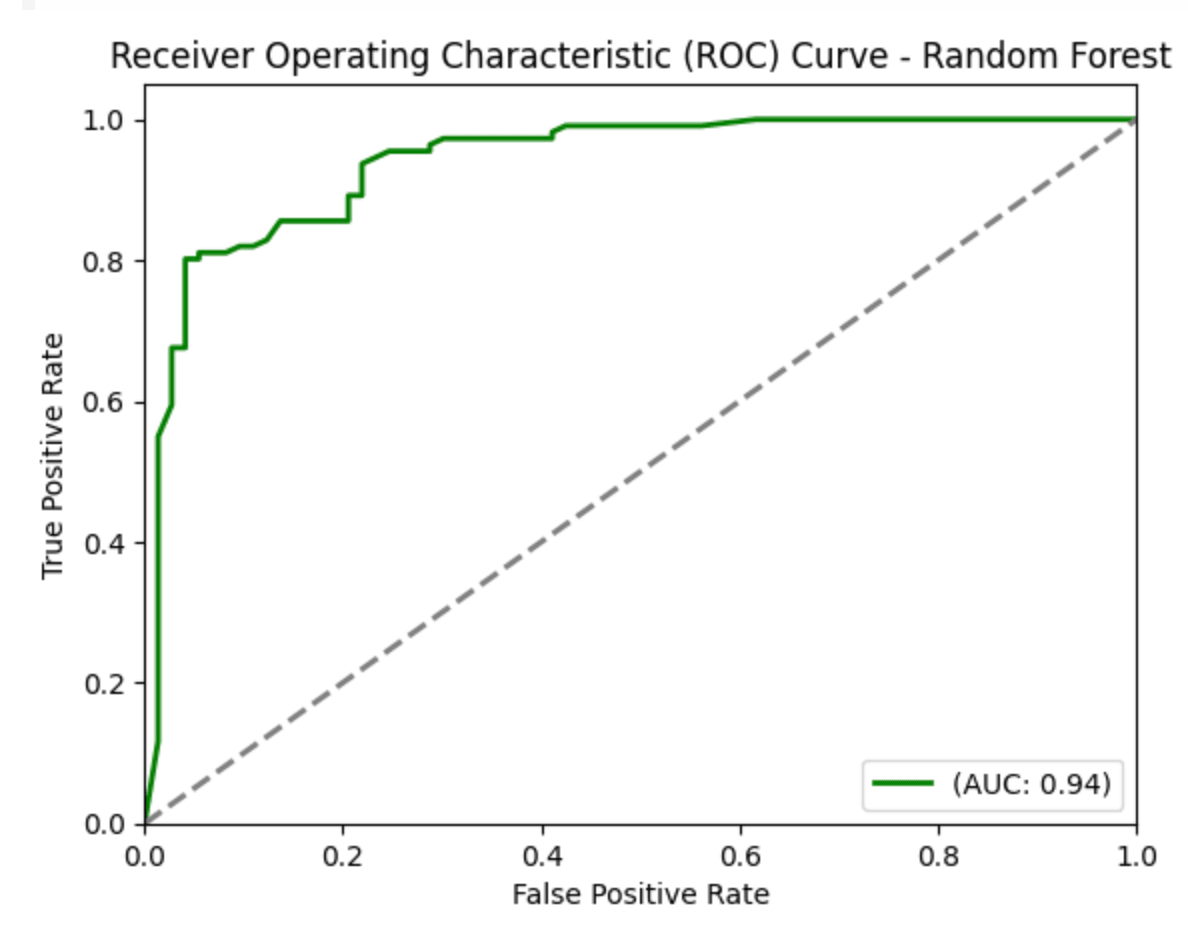
In my introductory machine learning project, I implemented Random Forest and Logistic Regression models to predict heart disease among patients. This was my first dive into machine learning and taught me how to choose a model, conduct basic exploratory data analysis, and evaluate models.
2022 Diamond Price Analysis
For the following project, I implemented an in-depth regression analysis to examine what factors had an effect on diamond prices in 2022. I conducted feature selection, polynomial transformation and identification of unusual observations to obtain the final model. We ultimately found that carat, clarity and color had statistically significant effects on 2022 diamond prices.
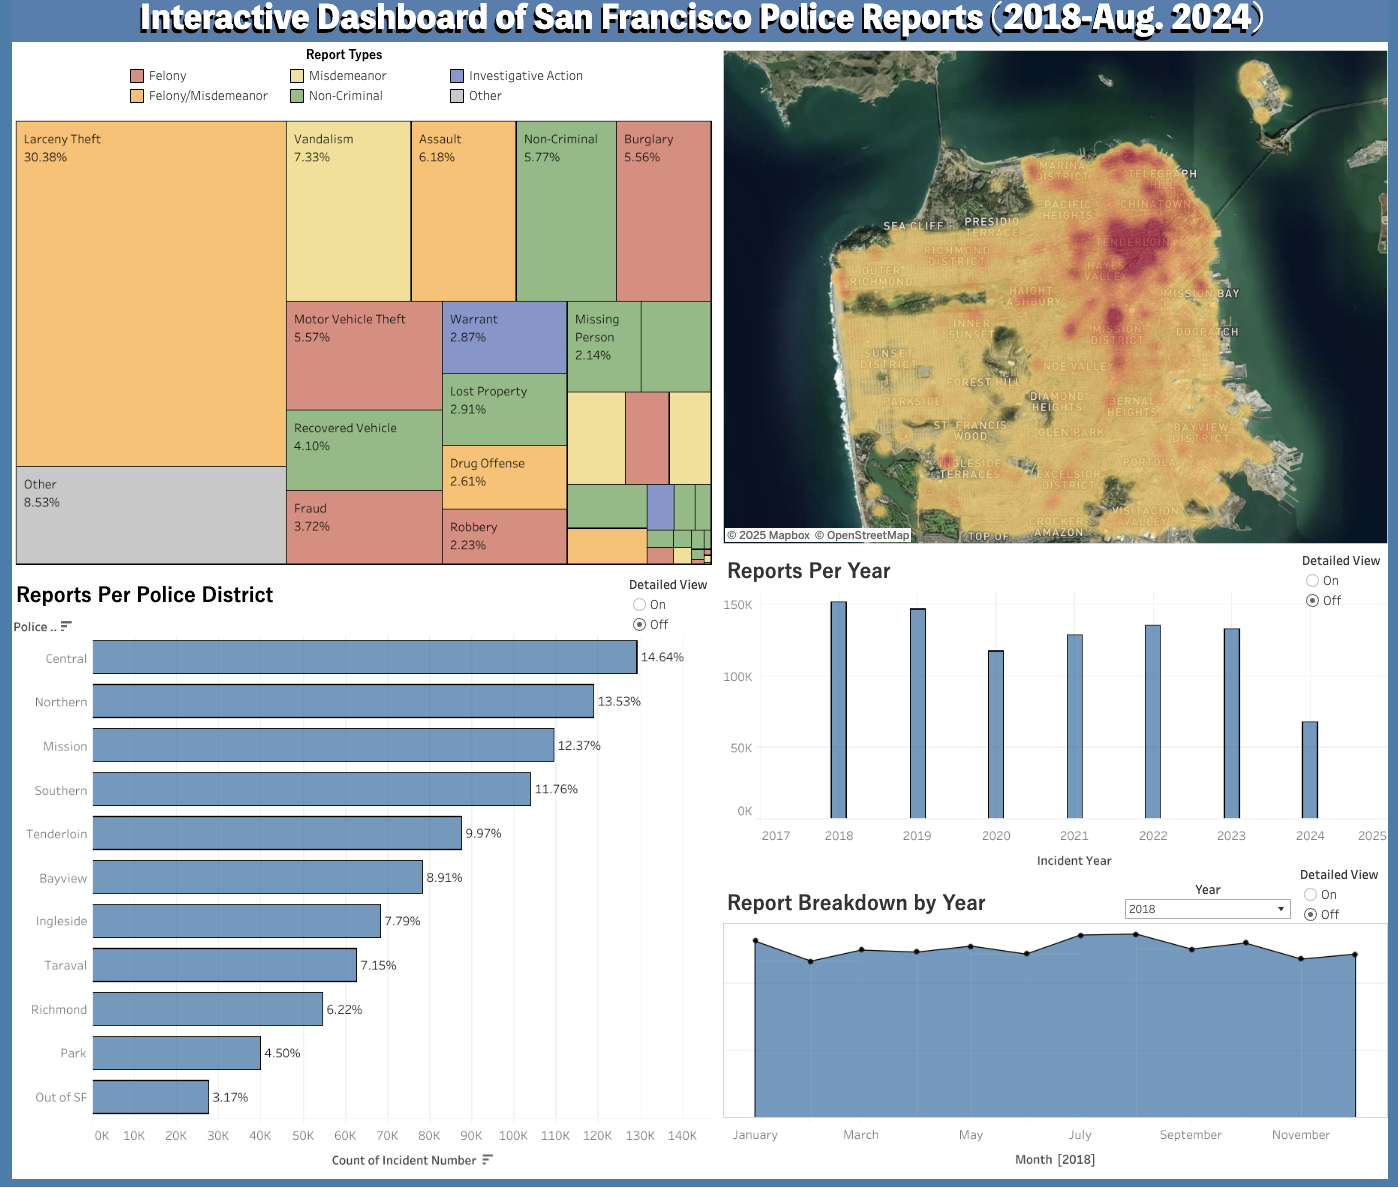
Interactive Dashboard of San Francisco Police Reports
This project utilized data from the city/county of San Francisco to create an interactive dashboard visualizing police reports from January 2018 to August 2024. Over 800,000 observations of data were cleaned in Python in order to provide a user-friendly, comprehensive breakdown of the data. You can interact with the dashboard by clicking the button below!
Simulation Study of ANOVA
In this study, I analyzed the performance of the ANOVA test (F-test) under various conditions. Millions of simulations were run to identify situations where the ANOVA test performed well, and other situations where a permutation test may be better used. The full project can be found below which contains an in-depth description of the ANOVA test and visualization to support the study.