


.png)
🤠 About Me
Hi! My name is Cyrus Navasca and I’m going into my fourth-year at UC Santa Barbara studying Statistics, Data Science and Math.
I am proficient in Python, R, SQL and Tableau among other languages with experience in predictive modeling, data analysis and agentic AI. I currently work as a Data Science & AI Intern at a fast-paced B2B startup at the intersection of AI agents and machine learning.
Through various internships and technical experiences, I have grown into a confident problem-solver, an effective collaborator, and a quick adapter in fast-paced settings. Outside of work, I love watching football (go Niners!), playing card games and trying new coffee shops.
I can be reached at cyrusnavasca@ucsb.edu, feel free to reach out and I am excited to hear from you all!
📝 Resume
📚 Education
University of California, Santa Barbara | Santa Barbara, CA
B.S. in Statistics & Data Science, Minor in Mathematics
3.63 GPA | Dean’s Honor Roll
💼 Experiences
Data Science & AI Intern @ Elas
As a Data Science & AI Intern so far, I have developed an AI agent that processes natural language queries to conduct predictive modeling and forecasting. I also designed a comprehensive PostgreSQL database schema with a flexible data model to support dynamic field storage, and implemented RESTful APIs to enable CRUD operations to support client sales workflows.
Working in a fast-paced but collaborative startup environment has strengthened my ability to ask meaningful questions, and adapt to new tools in order for me contribute effectively to the team. Stay updated with the company’s developments at their website below!

Data Analytics Research Asisstant @ META Lab
META Lab conducts experimental studies to examine the psychological effects of various states and conditions on traits such as curiosity and personality. I lead statistical analysis in the lab conducting A/B testing, mediation analysis and regressions. I am also responsible for rigorous data preprocessing prepare raw data for analysis.

Data Analytics Intern @ Daily Nexus
Daily Nexus is the official university newspaper for UC Santa Barbara. As a Data Analytics Intern, I am responsible for collecting, cleaning and reporting data. Specifically, my goal is to tell stories from messy data which are relevant to my surrounding community.
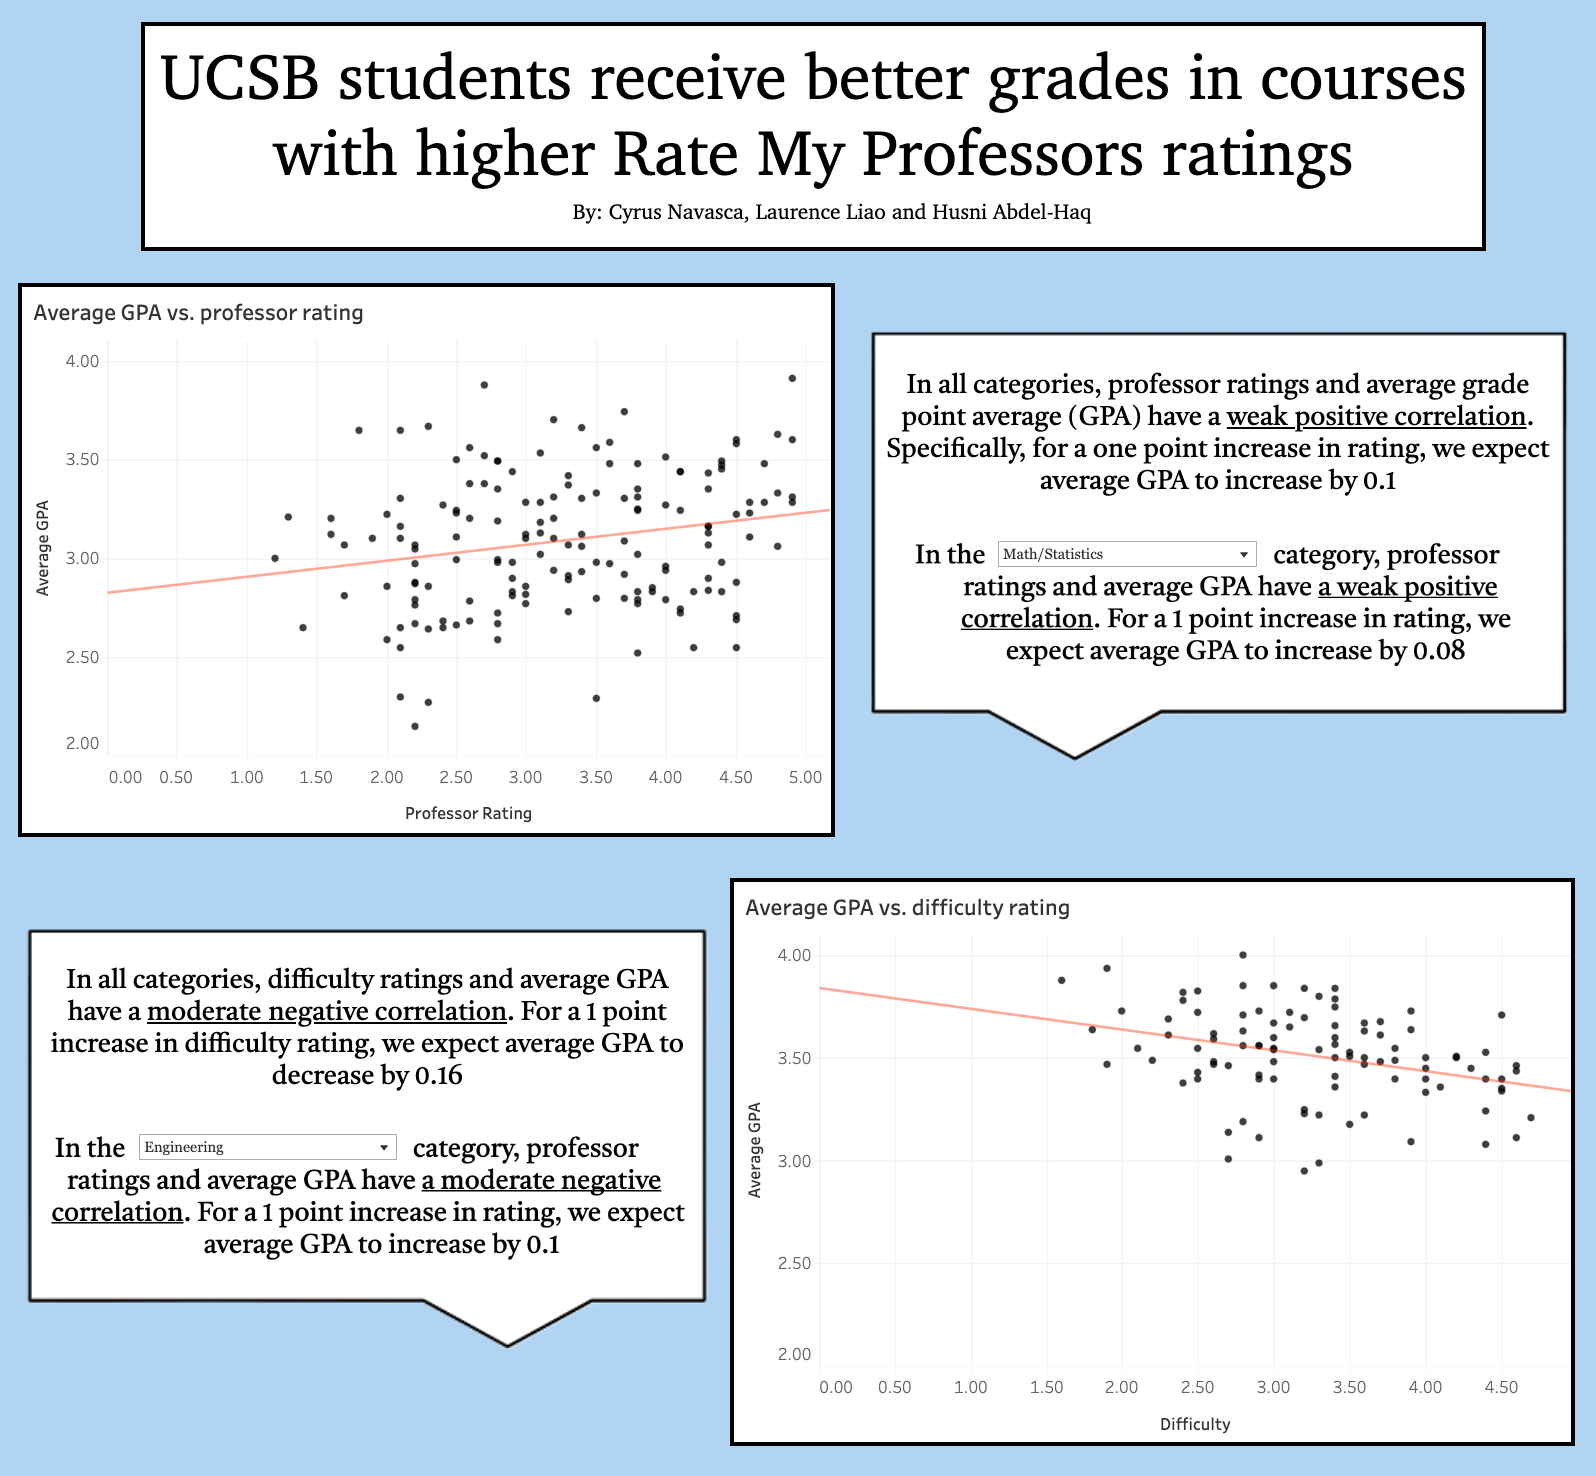
Recently, I have completed my first piece at the Daily Nexus, which was an analysis on the relationship between Rate My Professors ratings and student GPAs at UC Santa Barbara. To interact with my dashboard, click the button below!
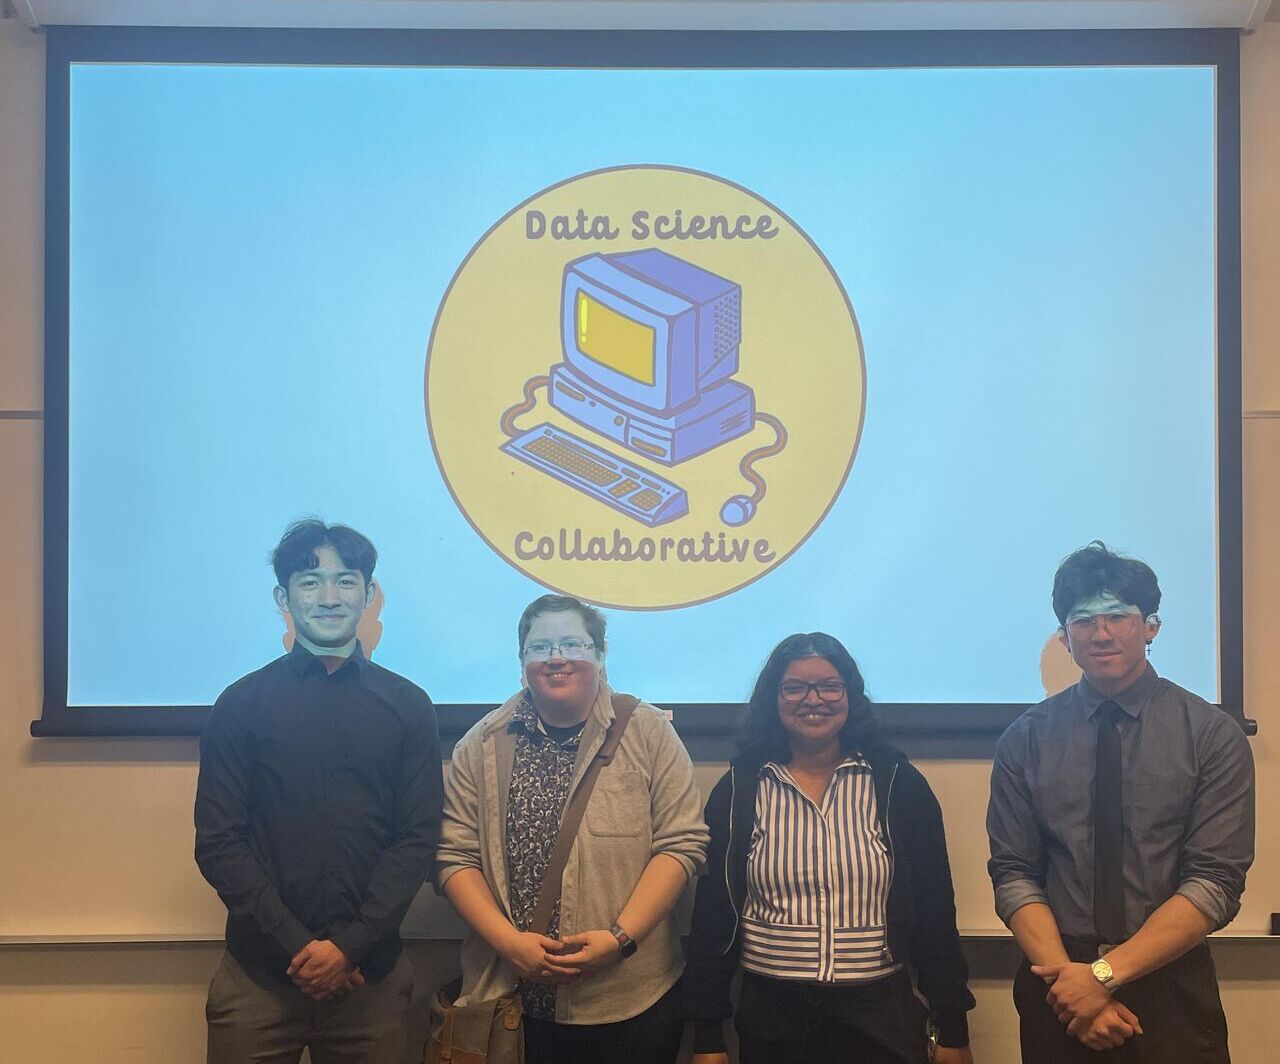
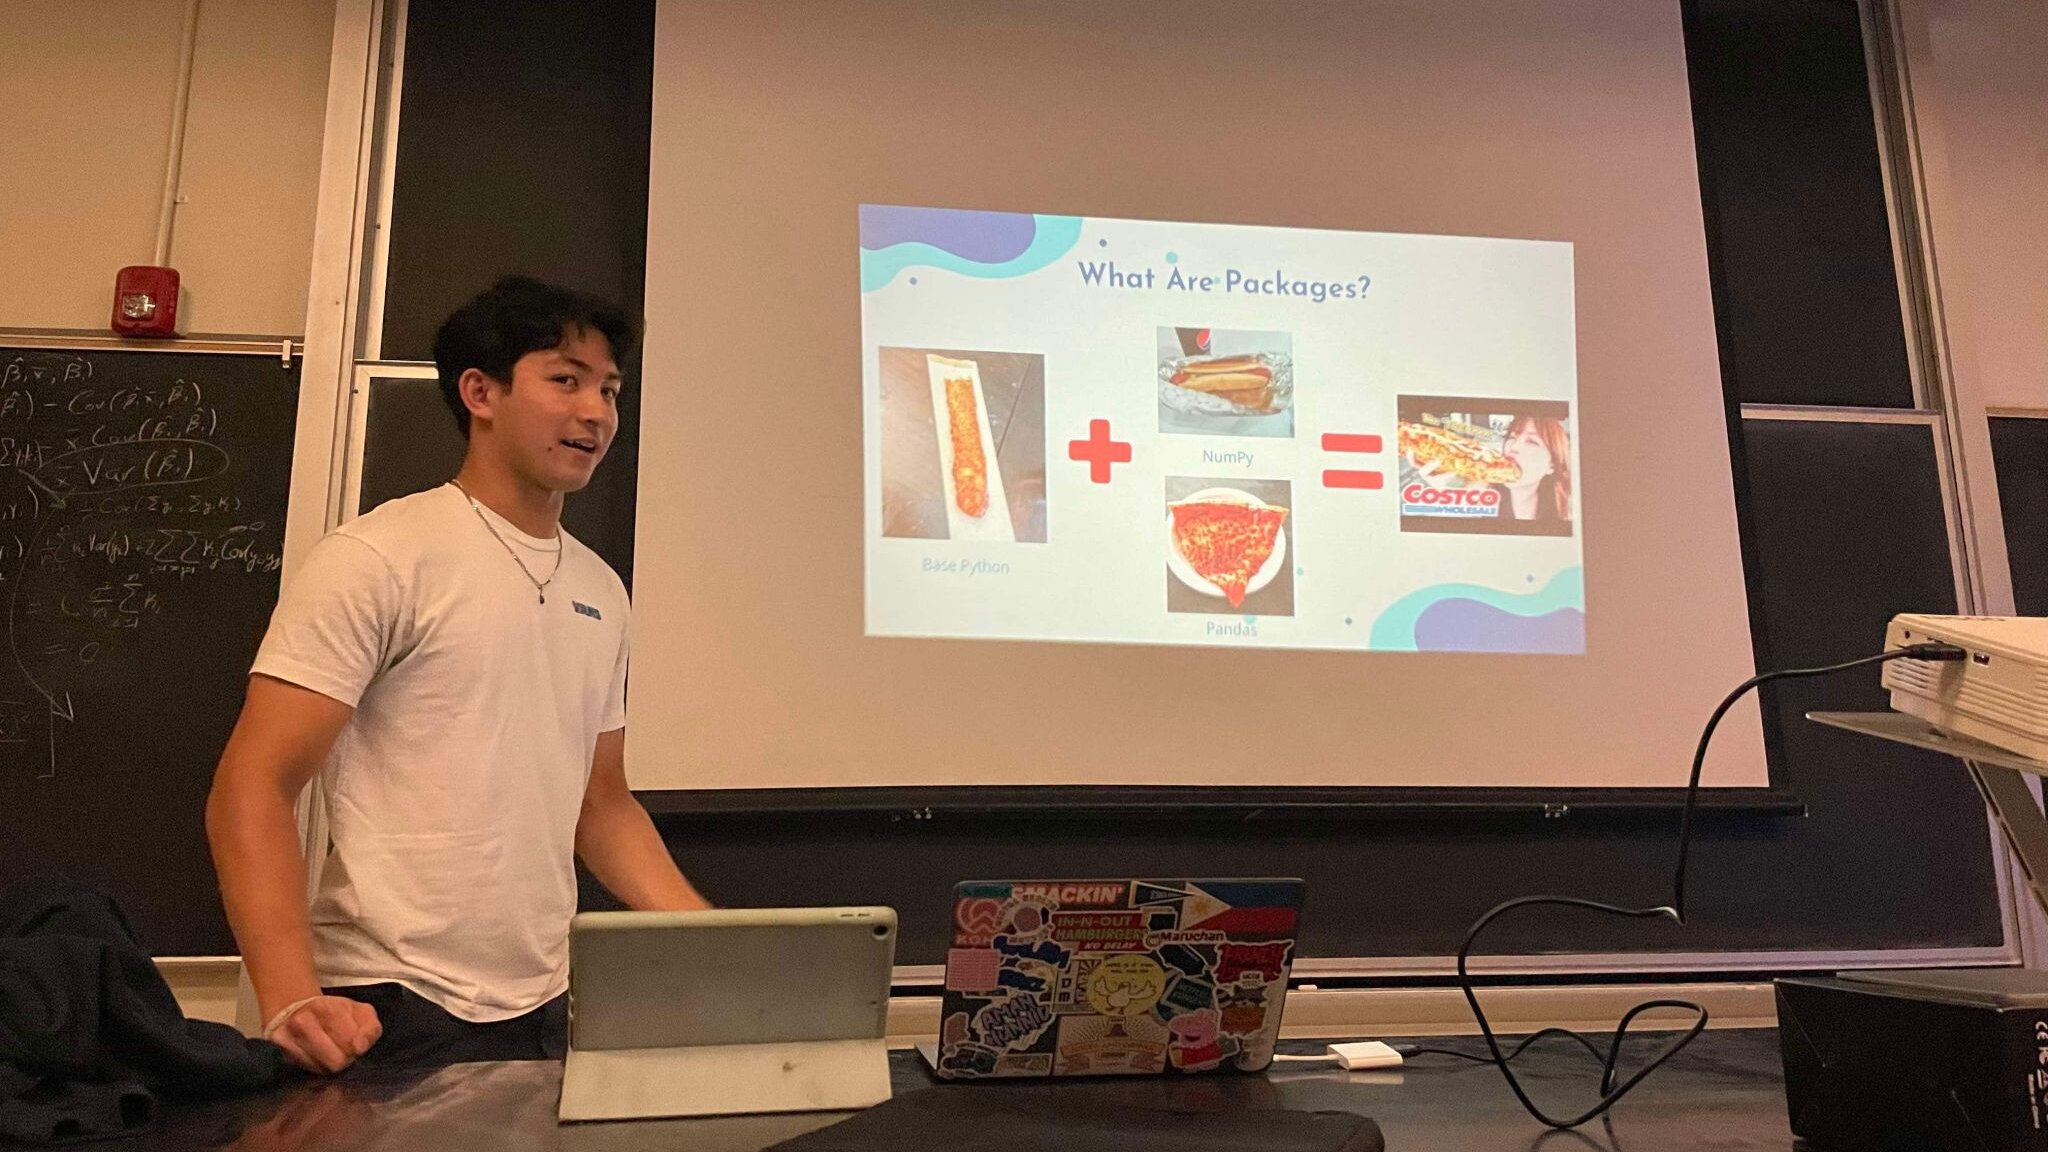
President @ UCSB Data Science Collaborative
The UCSB Data Science Collaborative aims to make the field of data science accessible to new students and non-majors. During my time as President, I have mentored over 150 members and organized engaging networking events. I have also taught workshops in topics such as data visualization, cleaning and machine learning, equipped with engaging presentation slides, and practice worksheets using sample datasets.
Being able to support new and ambitious students has been an extremely fulfilling experience. Additionally, I have learned so much from by breaking complex concepts into digestible pieces for members. This experience is one that has both reinforced my technical expertise and enhanced my interpersonal skills. Our website can be found below where you can find club photos along with my workshop presentations and worksheets!
📊 Projects
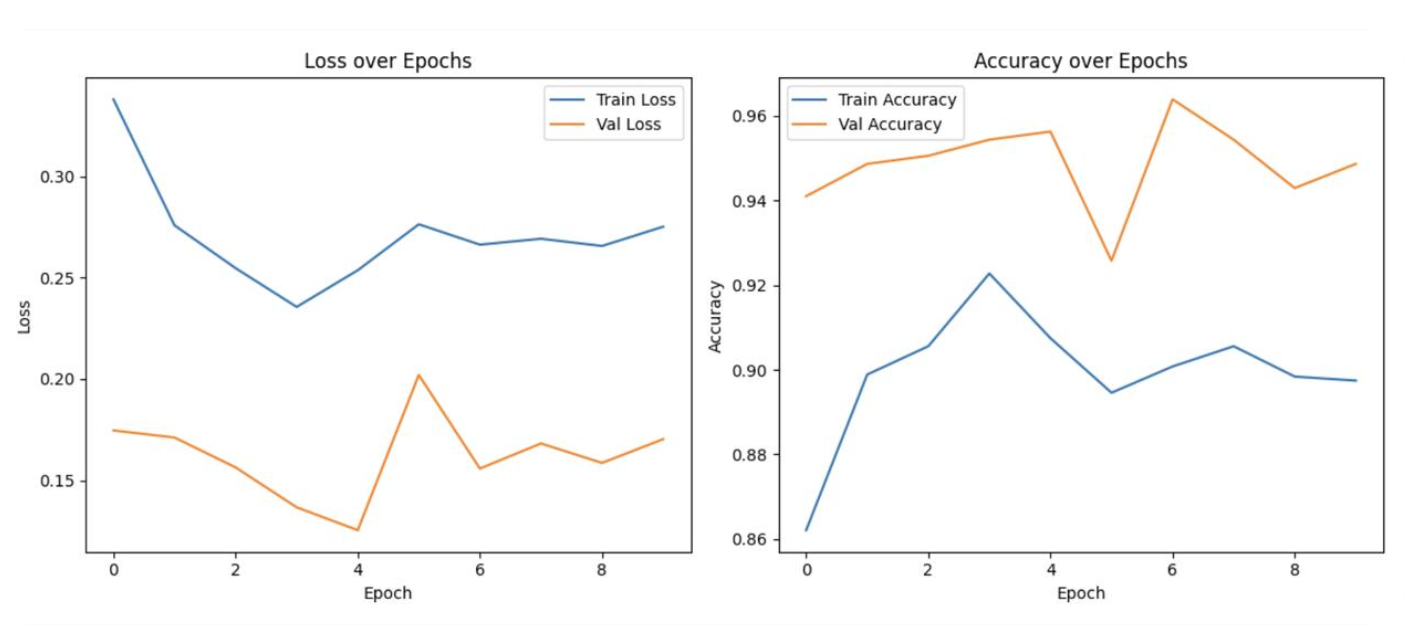
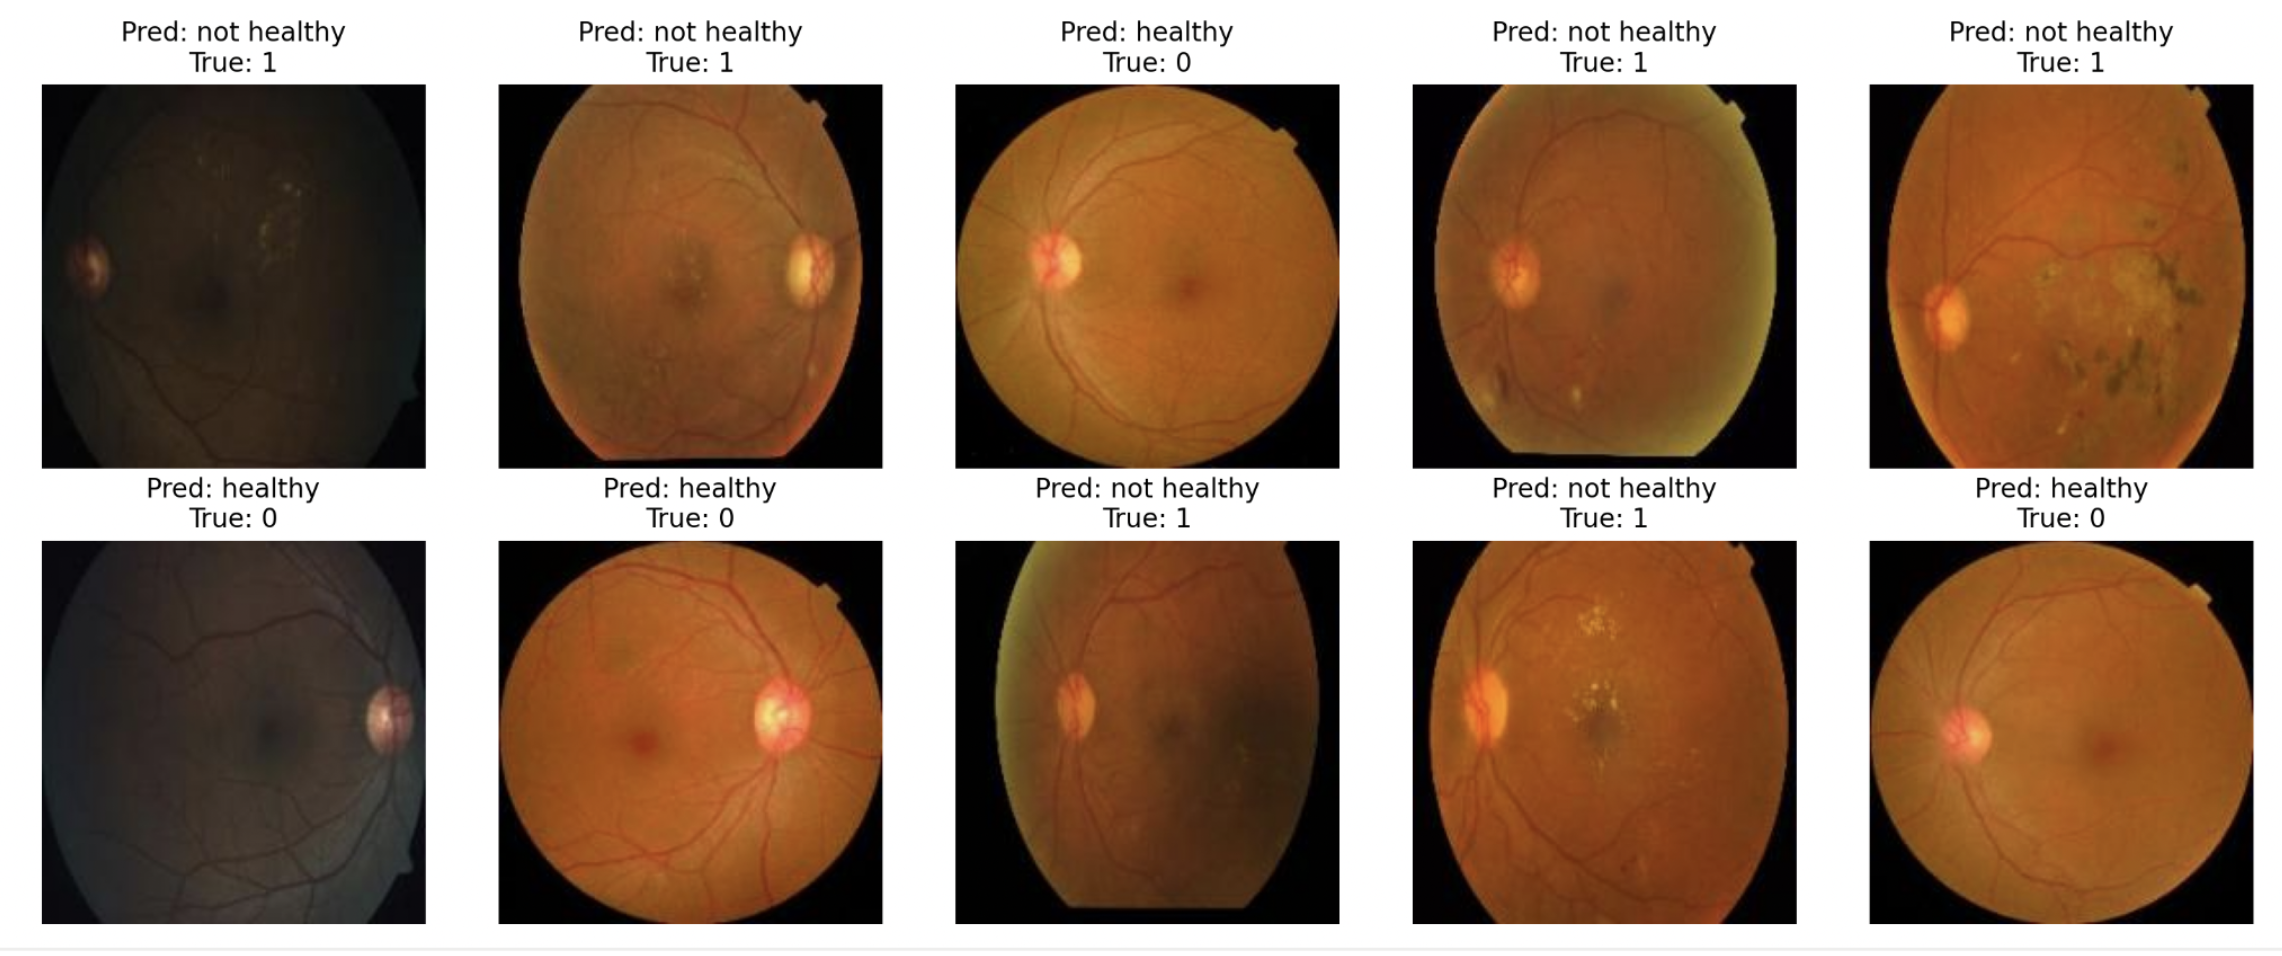
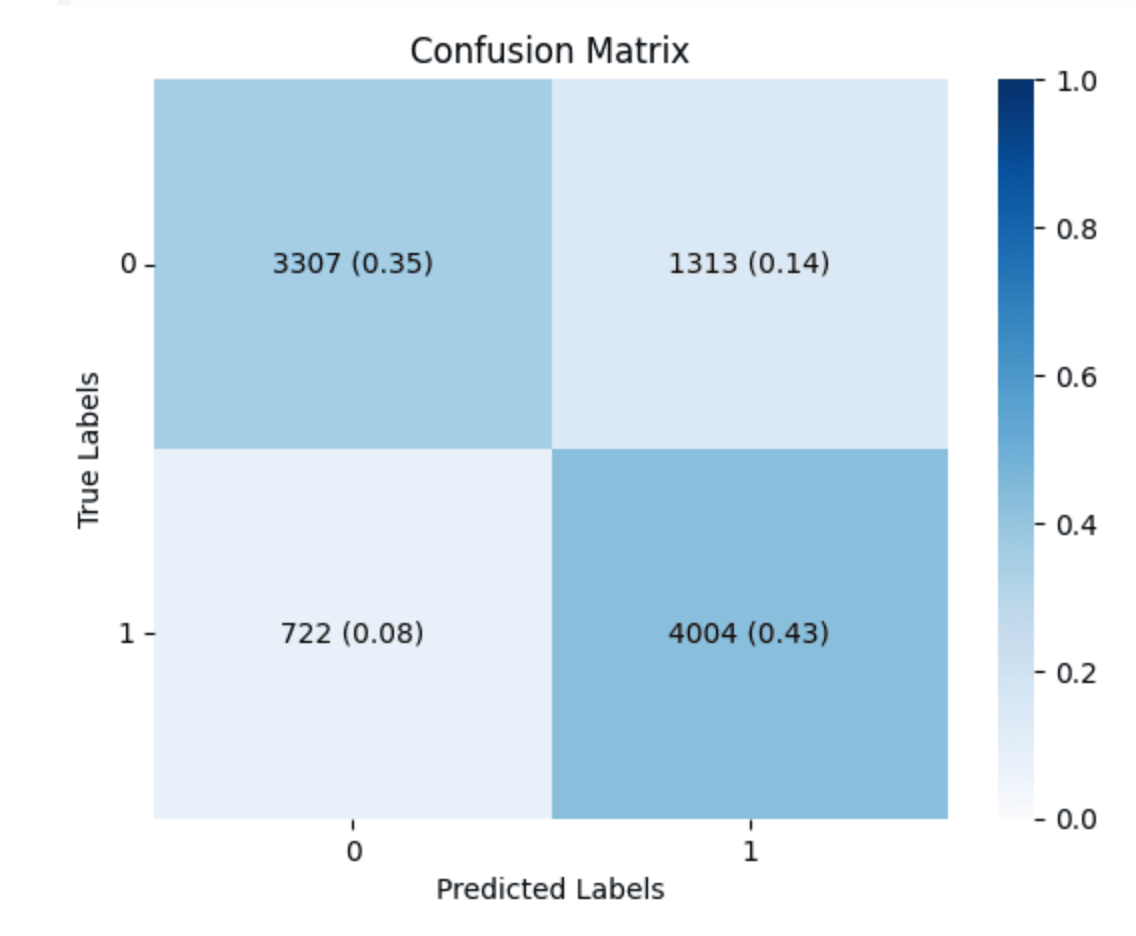
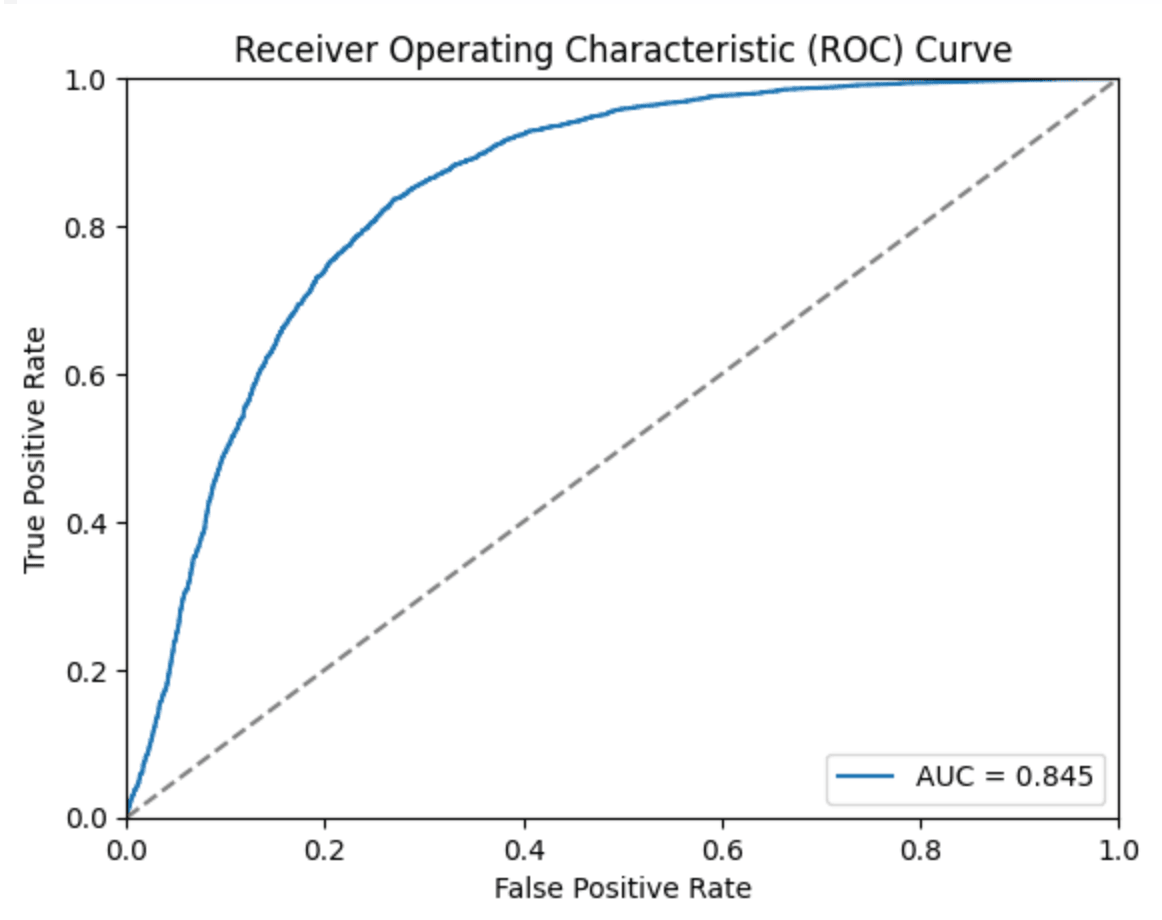
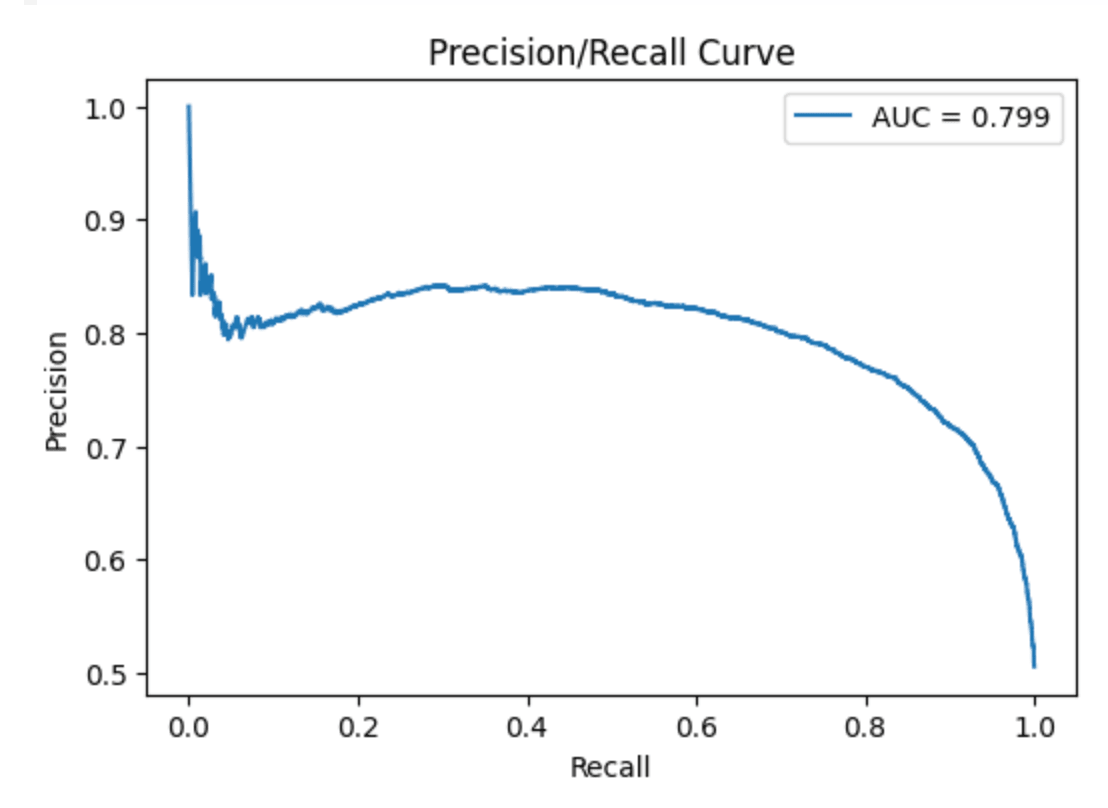
Detecting Diabetic Retinopathy w/ Computer Vision
For this project, my team and I trained a ResNet50 CNN to detect diabetic retinopathy, an eye disease that affects millions worldwide, from pateint retina scans. We implemented rigorous data augmentation and regularization to combat overfitting and achieved a 96% accuracy. Moreover, we integrated AWS S3 for efficient data storage and retrieval throughout the training pipeline.
Visit the project’s repository below!
Predicting Credit Card Default with Neural Networks
In this project, I utilized PyTorch to construct a neural network which predicts credit card default among clients. Using various statistical techniques, model performance was improved by 140%. The final model achieved a prediction accuracy of 78% and performed well according to other evaluation metrics such as ROC-AUC and precision/recall.
The full project including code and visualizations can be found in the GitHub repository below.
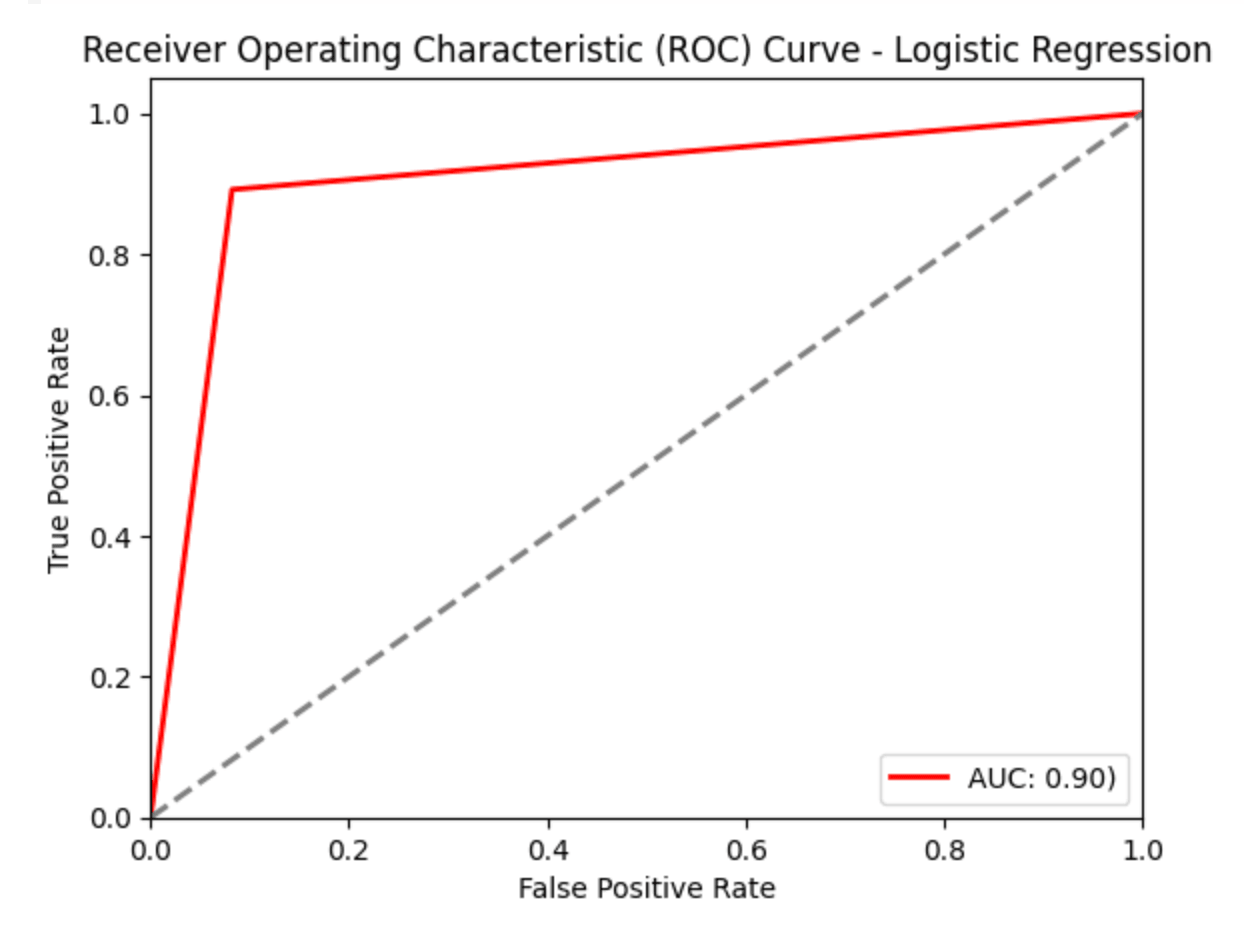
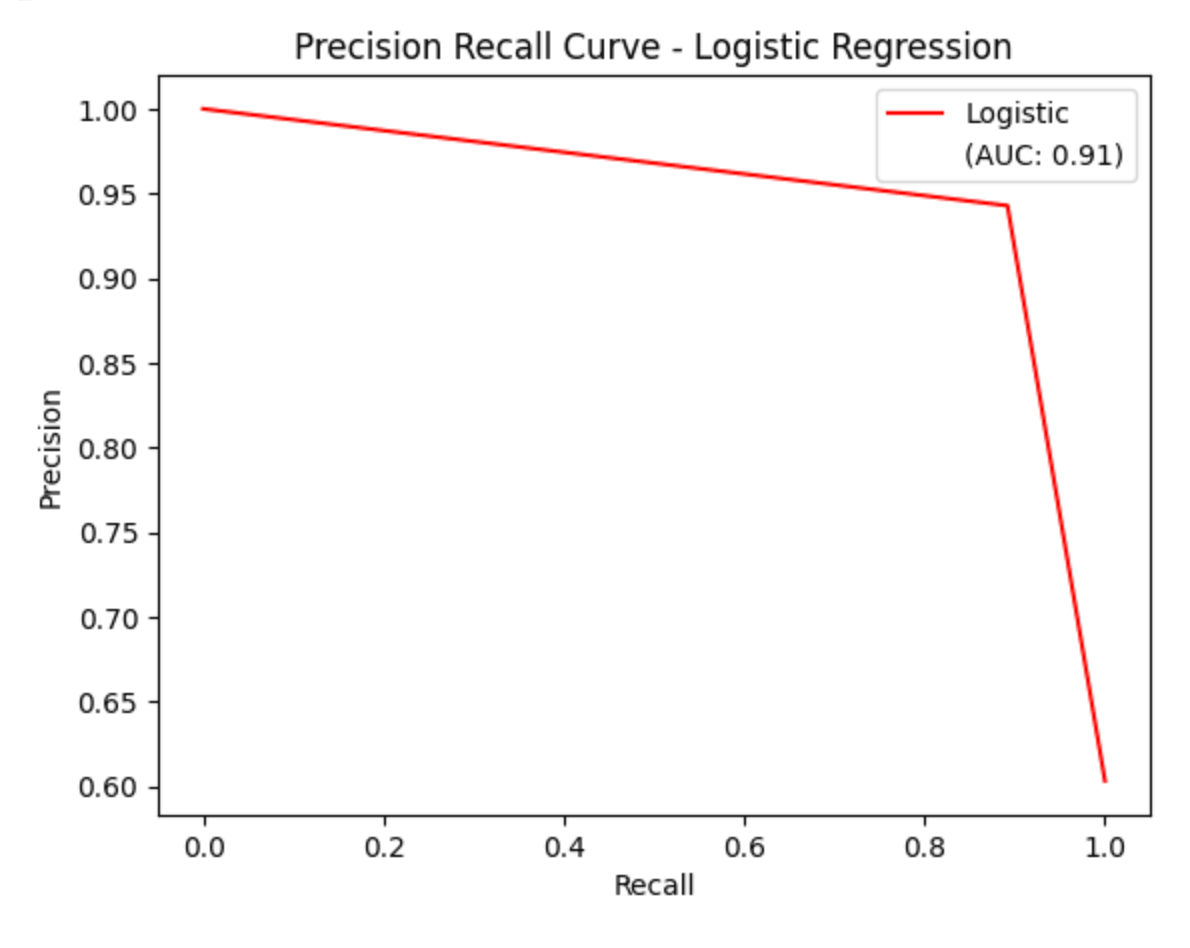
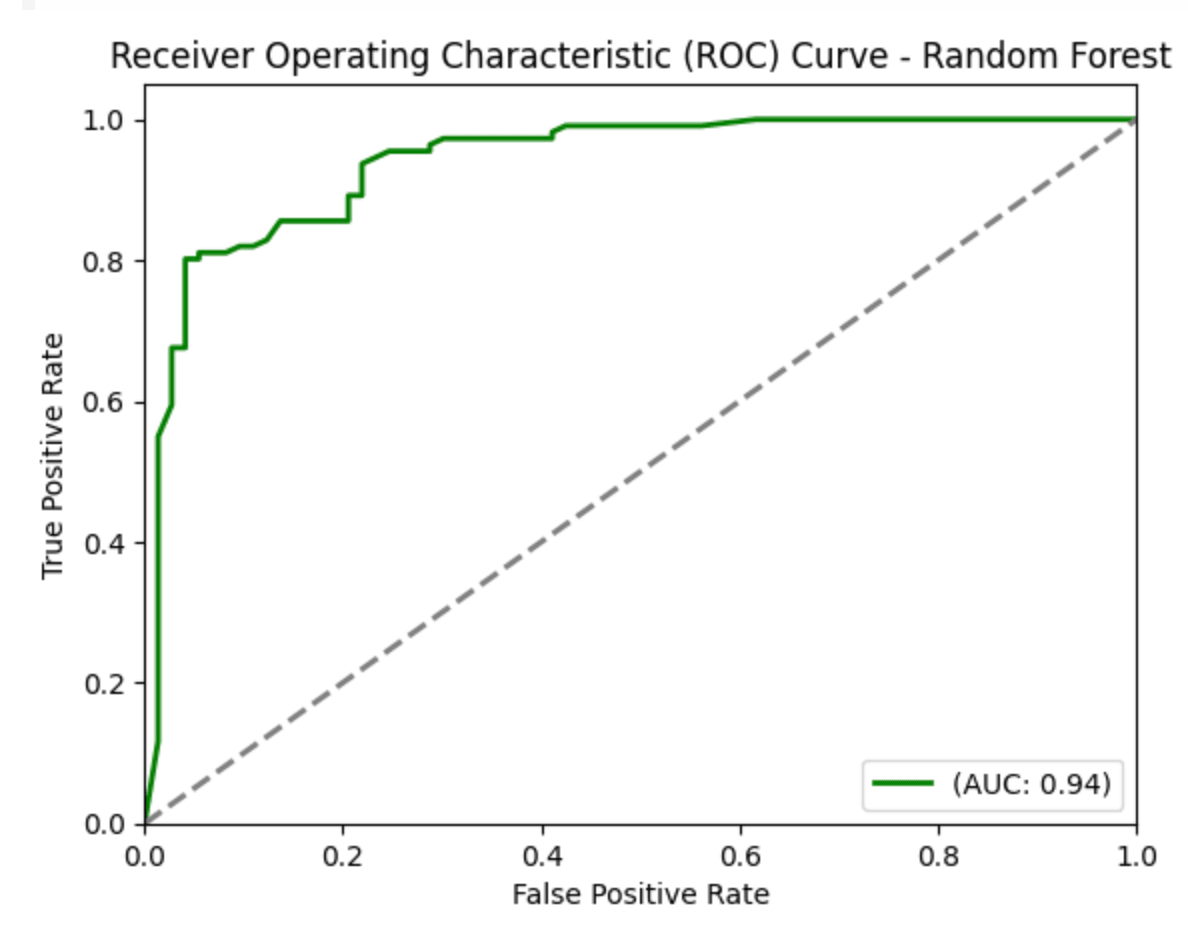
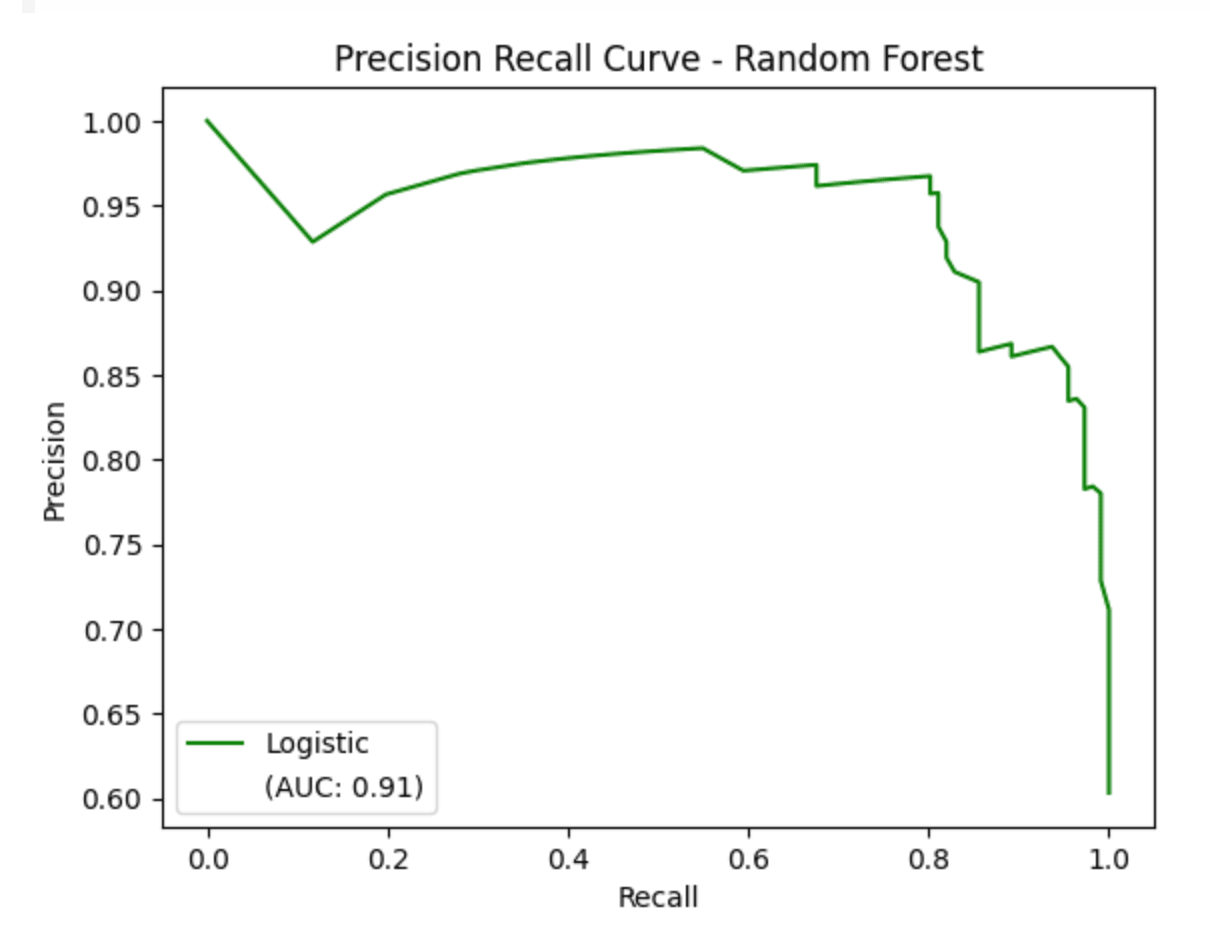
Predictive Modeling of Heart Disease
In my introductory machine learning project, I implemented Random Forest and Logistic Regression models to predict heart disease among patients. This was my first dive into machine learning and taught me how to choose a model, conduct basic exploratory data analysis, and evaluate models.
2022 Diamond Price Analysis
For the following project, I implemented an in-depth regression analysis to examine what factors had an effect on diamond prices in 2022. I conducted feature selection, polynomial transformation and identification of unusual observations to obtain the final model. We ultimately found that carat, clarity and color had statistically significant effects on 2022 diamond prices.
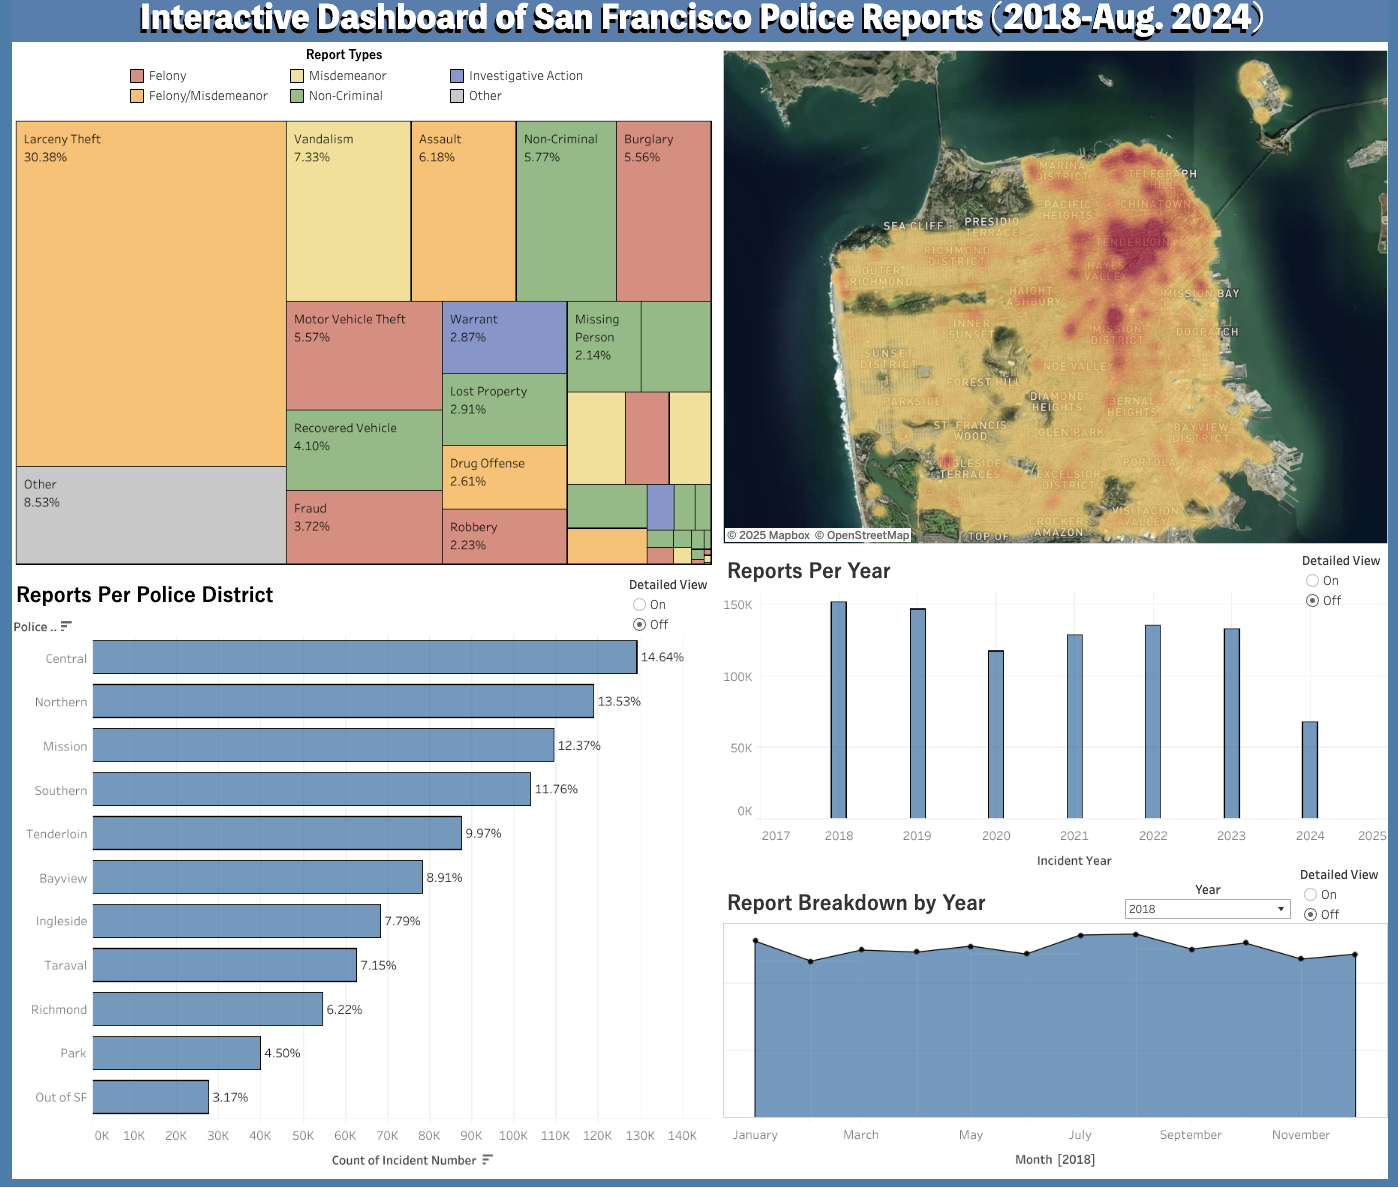
Interactive Dashboard of San Francisco Police Reports
This project utilized data from the city/county of San Francisco to create an interactive dashboard visualizing police reports from January 2018 to August 2024. Over 800,000 observations of data were cleaned in Python in order to provide a user-friendly, comprehensive breakdown of the data. You can interact with the dashboard by clicking the button below!
Simulation Study of ANOVA
In this study, I analyzed the performance of the ANOVA test (F-test) under various conditions. Millions of simulations were run to identify situations where the ANOVA test performed well, and other situations where a permutation test may be better used. The full project can be found below which contains an in-depth description of the ANOVA test and visualization to support the study.